The challenge is that insulation performance in moulded plastic parts is defined by multiple interdependent properties — none of which behave as fixed values in service. They degrade with temperature, moisture, aging, and mechanical stress. And the rated values on material datasheets reflect laboratory specimens under controlled conditions, not the weld lines, variable wall thicknesses, and contaminated surfaces of production parts in the field.
This article covers the key properties that govern electrical insulation performance in plastic parts, how those properties shift under real operating conditions, and where common specification errors lead to in-service failures.
Key Takeaways
- Electrical insulation performance is defined by a property profile — dielectric strength, resistivity, CTI, dielectric constant, and flame retardancy — not any single value
- All these properties degrade with temperature, moisture, and aging — datasheet values at 23°C rarely reflect real service conditions
- Standards like IEC 60243, ASTM D149, IEC 60112, and UL 94 govern testing, but lab values don't transfer directly to moulded production parts
- Polymer selection requires balancing all performance axes simultaneously: electrical, thermal, mechanical, and environmental
- The most common specification error: treating rated dielectric strength as an operating voltage limit — it marks breakdown, not safe working voltage
What Electrical Insulation Means in the Context of Plastic Parts
Electrical insulation, in technical terms, is the ability of a material to resist current flow, maintain voltage isolation between conductors, and prevent unintended current paths. This makes it a design parameter first — the geometry, environment, and service conditions of a moulded part determine whether a given polymer's insulation properties are actually sufficient.
Plastic insulation parts also carry a dual function. They act simultaneously as electrical barriers and as structural or thermal components in assemblies: connectors, terminal blocks, relay housings, motor slot liners, cable management clips.
The mechanical design of the part matters too. Wall thickness, gate location, and weld line position all directly influence how the electrical properties are realised in the moulded component, not just in the flat test specimen.
Bulk vs. Surface Insulation: Two Different Failure Modes
Most engineers think of dielectric strength when asked about insulation performance. But ASTM D257 separates two distinct electrical failure dimensions that must both be evaluated:
- Volume resistivity — resistance to leakage current through the body of the material (bulk failure)
- Surface resistivity — resistance to leakage current along the surface of the part (surface failure)
These are not interchangeable. A material with excellent volume resistivity can still fail by surface tracking under contamination or humidity — and surface failure is the more common in-service mode, particularly in parts exposed to condensation, dust, or ionic contaminants.
Key Polymer Families for Electrical Insulation Parts
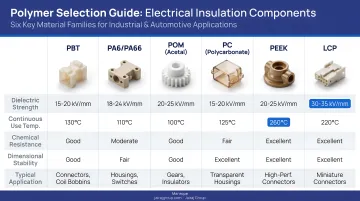
| Polymer | Typical Applications | Primary Electrical Advantage |
|---|---|---|
| PA (Polyamide) | Connectors, terminal blocks, relay brackets | High strength, good CTI — but moisture-sensitive |
| PBT | Relay housings, coil formers, power switches | Low moisture uptake, strong surface resistivity |
| PEEK | Aerospace, high-temperature electrical systems | Exceptional thermal stability, high resistivity |
| PP | Cable management, general housings | Low cost, chemically resistant |
| PVC | Conduit, industrial enclosures | Inherent flame resistance |
| PEI | High-heat electrical components | Elevated thermal resistance, good dielectric properties |
Material selection involves trade-offs across electrical, thermal, and mechanical performance. The right polymer depends on which failure mode your application is most exposed to — and that question is best answered before tooling is cut.
Key Performance Properties of Electrical Insulation Plastic Parts
Dielectric Strength
Dielectric strength is the maximum voltage a material can withstand per unit thickness before breakdown — measured in kV/mm and tested to IEC 60243-1:2013 or ASTM D149-20 at power frequencies of 48–62 Hz.
A few facts that datasheets often obscure:
- BASF Ultramid A3X2G10 (PA66) reports 33 kV/mm dry and 30 kV/mm conditioned — a meaningful difference driven purely by moisture state
- Victrex PEEK 450G shows 200 kV/mm at 0.05 mm thickness but only 23 kV/mm at 2 mm — a 9× reduction just from increasing specimen thickness
That second point is critical. ASTM D149-20 explicitly states that results "can seldom be used directly to determine dielectric behaviour in an actual application." Operating voltage in service must be kept well below the rated breakdown value, with design margins informed by the applicable product safety standard — not a generic rule of thumb.
Volume and Surface Resistivity
Volume resistivity governs bulk leakage current; surface resistivity governs current paths across part surfaces. Both are measured under ASTM D257 and reported separately because they respond differently to environmental exposure.
Key data points from verified sources:
- BASF Ultradur B 4450 G5 (PBT): volume resistivity 1×10¹³ Ω·m, surface resistivity 1×10¹⁴ Ω (inherently stable due to low moisture uptake)
- BASF Ultramid A3X2G10 (PA66): volume resistivity 1×10¹³ Ω·m dry dropping to 1×10¹⁰ Ω·m conditioned — a 1,000× shift from moisture alone
Surface resistivity becomes the dominant concern under contamination or humidity, where ionic deposits form conductive pathways across the part surface before bulk breakdown ever occurs.
Dielectric Constant and Dissipation Factor
Where resistivity defines how well a material blocks current, dielectric constant and dissipation factor determine how it behaves under AC and high-frequency conditions — a separate but equally critical performance dimension:
- Dielectric constant (permittivity): Higher values increase capacitive coupling between conductors — problematic in dense electrical assemblies
- Dissipation factor (loss tangent): Energy lost as heat; high dissipation factor risks thermal runaway in sensitive electronics
Both are frequency- and temperature-dependent. Victrex PEEK 450G shows a dielectric constant of 3.00 at 23°C, 50 Hz rising to 4.50 at 200°C, 50 Hz — a shift that would alter circuit behaviour in a thermally loaded assembly.
Tracking Resistance (CTI)
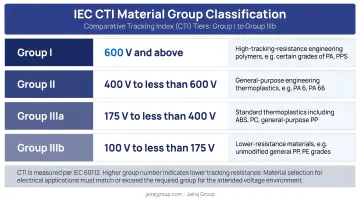
Dielectric properties describe behaviour under controlled conditions. Tracking resistance addresses what happens when contamination gets involved. Comparative Tracking Index (CTI), measured under IEC 60112:2025, defines a material's resistance to surface electrical breakdown that forms conductive carbon paths from dry-band arcing. Reported surface temperatures during tracking arcing can exceed 1,200°C, making this a genuine thermal hazard, not just a leakage concern.
IEC material groups based on CTI:
- Group I: CTI ≥ 600 (e.g., PA66 Ultramid A3X2G10, PBT Ultradur B 4450 G5 — both at CTI 600)
- Group II: 400 ≤ CTI < 600
- Group IIIa: 175 ≤ CTI < 400
- Group IIIb: 100 ≤ CTI < 175 (e.g., PEEK 450G at CTI 150)
IEC 60112 itself states CTI results are not directly suitable for evaluating safe creepage distances. CTI is a material screening tool — it must be combined with pollution degree, clearance, and the applicable product standard to define actual creepage requirements.
Flame Retardancy (UL 94)
UL 94 ratings define how a moulded plastic part responds to ignition — and the rating is thickness-, colour-, and formulation-specific, not a property of the base polymer alone.
| Rating | Criteria |
|---|---|
| V-0 | Afterflame ≤10 s; no flaming drips igniting cotton |
| V-1 | Afterflame ≤30 s; no flaming drips |
| V-2 | Afterflame ≤30 s; flaming drips permitted |
| HB | Horizontal burn ≤40 mm/min (>3 mm) or ≤75 mm/min (<3 mm) |
BASF Ultramid A3X2G10 illustrates thickness dependency: rated V-2 at 0.40–0.75 mm, but V-0 at 1.5 mm and above. Specifying UL 94 class requires knowing the actual part wall thickness, not just the material family.
Selecting the right material is necessary but not sufficient. Consistent insulation properties in moulded parts depend equally on process control during injection moulding — wall thickness variation, moisture content at the press, and cavity balancing all affect whether a part meets its rated electrical performance in service. Jairaj Group's injection moulding operations, built over four decades of polymer engineering, use PLC-controlled machinery and real-time process monitoring to maintain dimensional and material consistency in electrical-grade components such as relay housings, terminal blocks, and insulation brackets.
How Operating Conditions Affect Insulation Performance in the Field
Temperature Effects
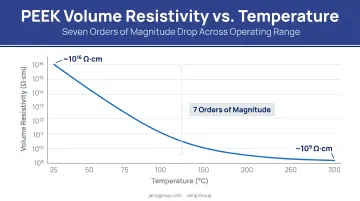
Rising temperature reduces both dielectric strength and volume resistivity in virtually all thermoplastics. The change is gradual — a continuous degradation curve that compounds with every degree of service exposure.
The Victrex PEEK 450G data makes this concrete:
- 23°C: volume resistivity = 1.0×10¹⁶ Ω·cm
- 125°C: volume resistivity = 1.0×10¹⁵ Ω·cm
- 275°C: volume resistivity = 1.0×10⁹ Ω·cm
That is a seven orders of magnitude shift between room temperature and high service temperature — for the same material. Treating room-temperature datasheet resistivity as the service-temperature value produces under-specified insulation.
Continuous use temperature (CUT) and heat deflection temperature (HDT) define the practical thermal limits for each polymer, but these must be cross-referenced with electrical property data at elevated temperatures. Alignment cannot be assumed.
Moisture and Humidity
Temperature is only one stress vector. Humidity introduces a separate degradation path that operates independently — and compounds damage when both are present.
Water absorption increases surface conductivity, promotes tracking, and reduces dielectric strength. The PA vs. PBT comparison shows the practical consequence:
- PA66 (Ultramid A3X2G10): saturation absorption 3.7–4.3%; volume resistivity drops 1,000× from dry to conditioned state
- PBT (Ultradur B 4450 G5): saturation absorption 0.9%; equilibrium moisture at 50% RH only 0.2%
Selecting PA for an application with significant humidity exposure requires evaluating conditioned electrical properties, not dry datasheet values. IEC 60212:2010 defines conditioning protocols for test reproducibility, but moisture conditioning state must be explicitly specified in both material comparison and part qualification.
Aging and Long-Term Degradation
Rated values at initial qualification do not represent end-of-life performance. Three degradation mechanisms matter most:
- UV exposure: causes chain scission in unprotected polymers, reducing mechanical integrity and opening micro-cracks in insulation barriers
- Thermal aging: oxidation and embrittlement reduce dielectric strength over extended service at elevated temperatures
- Mechanical fatigue: cyclic stress creates microvoids that accelerate electrical failure under voltage
BASF Ultramid A3X2G10 carries a UL 746C f1 outdoor designation for UV and water exposure — confirming that its outdoor performance is tested and rated, not extrapolated from indoor data. For materials without outdoor ratings, UV and thermal aging data must be sourced directly from the material supplier or independent testing.
How Insulation Properties Are Specified, Measured, and Validated
Standards and What They Actually Cover
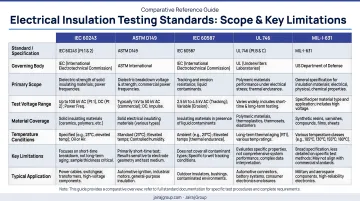
Each standard covers a specific measurement scenario — and each carries limitations that matter when translating lab data to production parts.
| Standard | Scope | Key Limitation |
|---|---|---|
| IEC 60243-1:2013 / ASTM D149-20 | Dielectric strength at 48–62 Hz | Lab specimen results; not directly transferable to moulded parts |
| ASTM D257 | Volume and surface resistivity (DC) | Must report electrode geometry and conditioning |
| IEC 60112:2025 | CTI/PTI determination up to 600 V AC | Not directly suitable for creepage distance design |
| UL 94 | Flammability classifications | Rating depends on thickness, colour, and formulation |
| IEC 60212:2010 | Pre-test conditioning | Conditioning standard, not an aging method |
Lab Conditions vs. Moulded Part Reality
Lab specimens are flat, uniform thickness, conditioned under standard humidity, and measured with controlled electrodes. Production moulded parts have:
- Variable wall thickness across the part
- Weld lines from multi-gate tooling
- Surface texture from mould finish or ejector marks
- Exposure to contamination, fluids, and thermal cycling
Each of these factors can reduce effective insulation performance relative to what the material datasheet reports. A part specification for an electrical insulation component should reference the test method, conditioning state (dry vs. moisture-conditioned), sample geometry, and the applicable product or safety standard. Carrying over a single datasheet number without engineering interpretation is not a reliable basis for design.
Implications of Performance Gaps and Common Misinterpretations
Three misinterpretations recur in electrical plastic part specifications — each one capable of producing insulation failures that only appear under real operating conditions.
Treating Dielectric Strength as an Operating Voltage Limit
Dielectric strength is a breakdown threshold, not a safe operating ceiling. The applicable product safety standard — not a generic safety factor — defines the required margin between operating voltage and breakdown voltage.
Using a material's rated dielectric strength as the maximum allowable operating voltage ignores ageing, temperature derating, and part geometry effects that all reduce effective insulation performance over service life.
Ignoring Moisture Effects on Surface Insulation
Surface tracking failures frequently occur in materials selected on bulk dielectric strength alone, without evaluating CTI or surface resistivity under humid conditions.
A polymer with strong volume resistivity but low CTI — PEEK at 150 V is a clear example — is poorly suited for contaminated-surface environments despite its otherwise strong electrical properties.
Over-Specifying One Property While Under-Specifying Others
Selecting a high-temperature polymer like PEEK purely for thermal performance, without reviewing its CTI classification, UL 94 rating at actual part thickness, and surface resistivity under expected contamination, is a common pattern that leads to field failures.
Insulation performance must be evaluated as a complete property profile:
- Dielectric strength (bulk breakdown threshold)
- Volume and surface resistivity (under expected humidity)
- CTI classification (contaminated-surface tracking resistance)
- UL 94 flame retardancy rating at actual part thickness
- Thermal class (operating temperature range)
No single property can be optimised in isolation without affecting the others.
Frequently Asked Questions
Which plastic is used for electrical insulation?
The most commonly used plastics include PA (Polyamide), PBT, PP, PVC, and high-performance grades like PEEK and PEI. Selection depends on the voltage class, operating temperature, moisture exposure, and required UL 94 flame rating of the specific application. No single material suits every application.
What are the electrical properties of plastic?
The key electrical properties are dielectric strength, volume resistivity, surface resistivity, dielectric constant, dissipation factor, and tracking resistance (CTI). These define how a part behaves as an insulator across voltage levels, AC frequencies, and environmental conditions.
What are the five most important properties for electrical insulation plastics?
Dielectric strength, thermal resistance (CUT/RTI), moisture resistance, tracking resistance (CTI), and flame retardancy. These properties interact: strength in one area does not guarantee performance in another, so all five must be evaluated together against application requirements.
How does temperature affect plastic insulation performance?
Rising temperature reduces dielectric strength and volume resistivity in most polymers, sometimes dramatically so. Victrex PEEK 450G loses seven orders of magnitude in volume resistivity between 23°C and 275°C. Continuous use temperature (CUT) ratings define the upper thermal boundary for reliable insulation performance.
What is dielectric strength and why does it matter?
Dielectric strength is the maximum voltage per unit thickness a material withstands before electrical breakdown, measured in kV/mm under IEC 60243 or ASTM D149. It is the primary comparison metric for insulating plastics, but must be applied with a design margin informed by the applicable safety standard — never used directly as a working voltage limit.
How are electrical insulation properties tested and validated in plastic parts?
Key standards include IEC 60243 (dielectric strength), ASTM D257 (resistivity), IEC 60112 (CTI), and UL 94 (flammability). Test conditions — geometry, moisture conditioning, temperature — must reflect real application conditions, because lab values from flat specimens consistently differ from performance in moulded production parts.